Orbit · Data science · Tools · September 2026
The org chart nobody draws
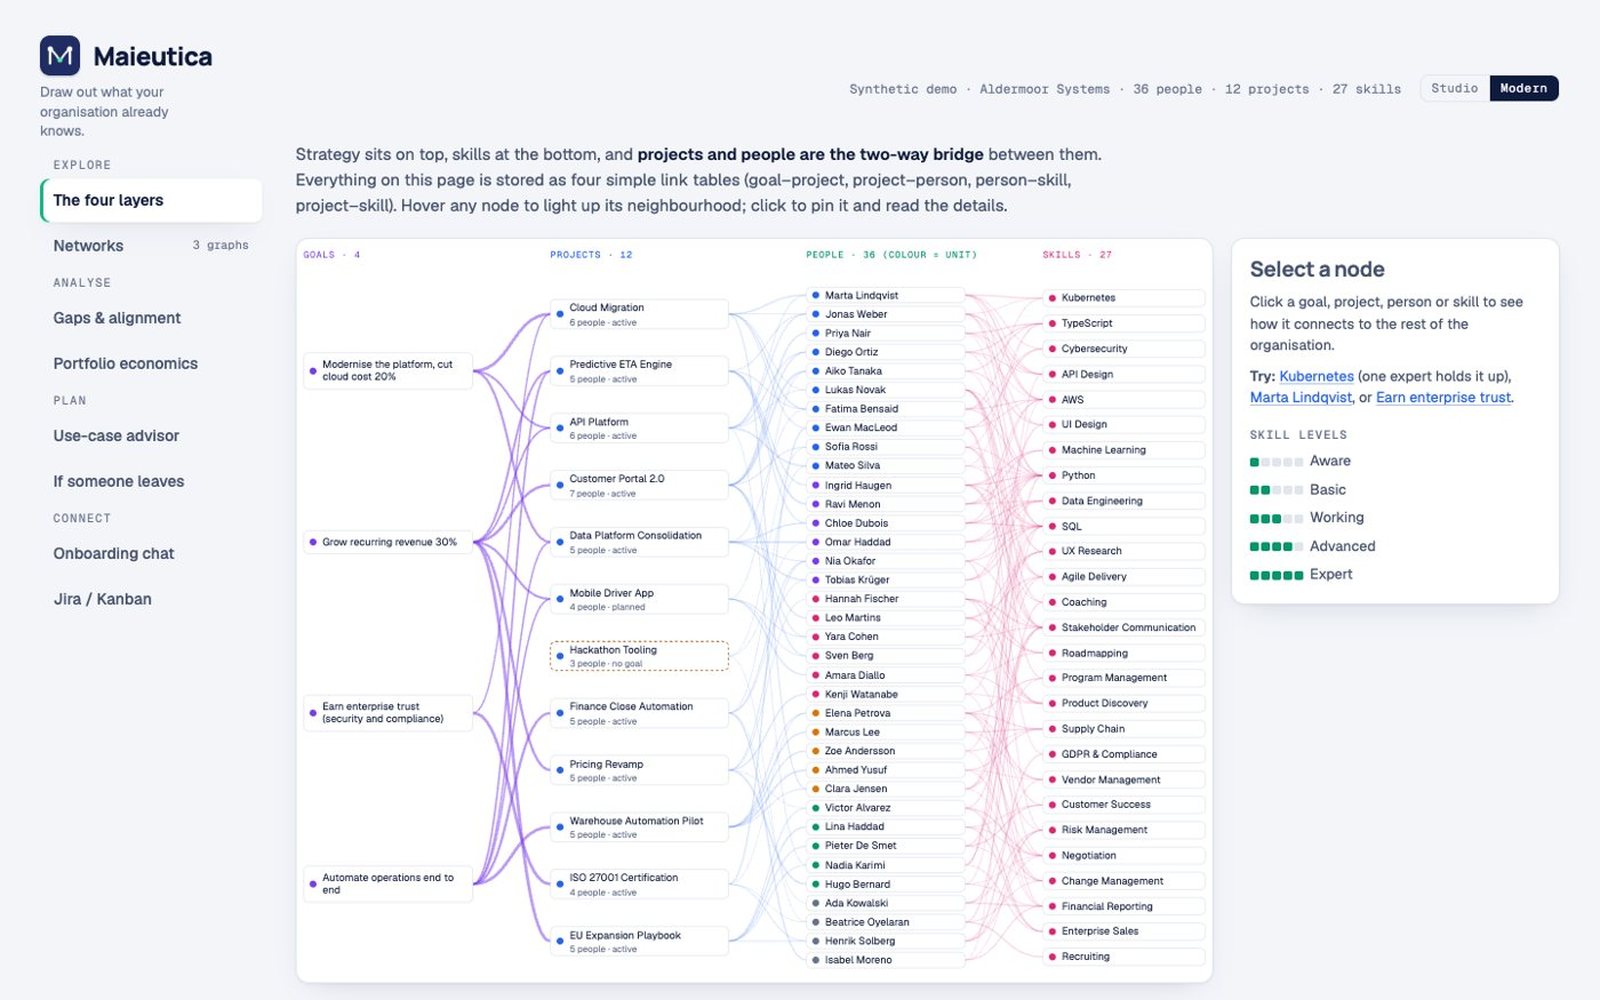
Maieutica. An organisation as one graph of goals, projects, people and skills, with the views leaders ask for. Built on a synthetic demo company.
Maieutics is Socrates' method: he said he was a midwife for ideas, helping people bring out knowledge they already carried. I keep thinking about it as a team lead, because most of what an organisation needs to know is already inside it, spread over people's heads and tickets. Nobody has drawn it.
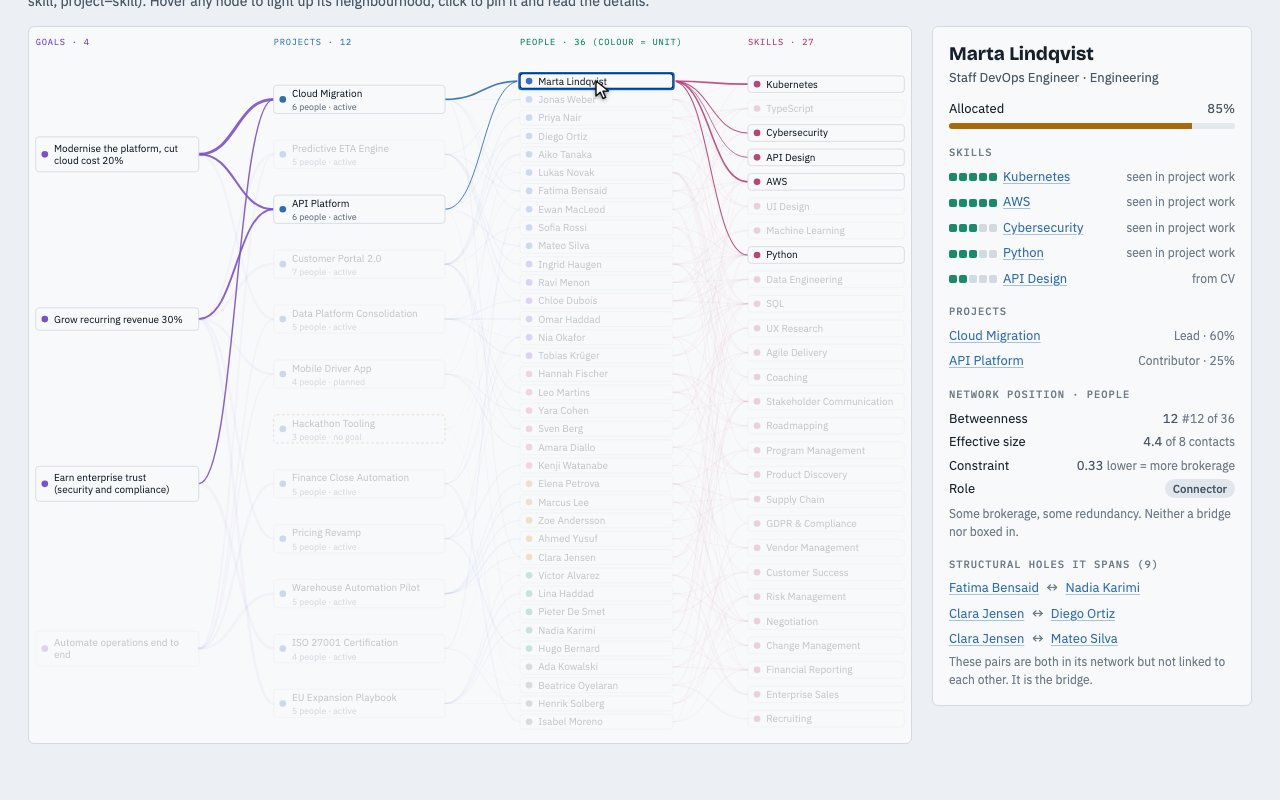
Maieutica draws it as one graph with four layers: goals, the projects that serve them, the people on those projects and the skills those people use. Four link tables are enough. The networks of people, of skills and of use cases are computed from them.
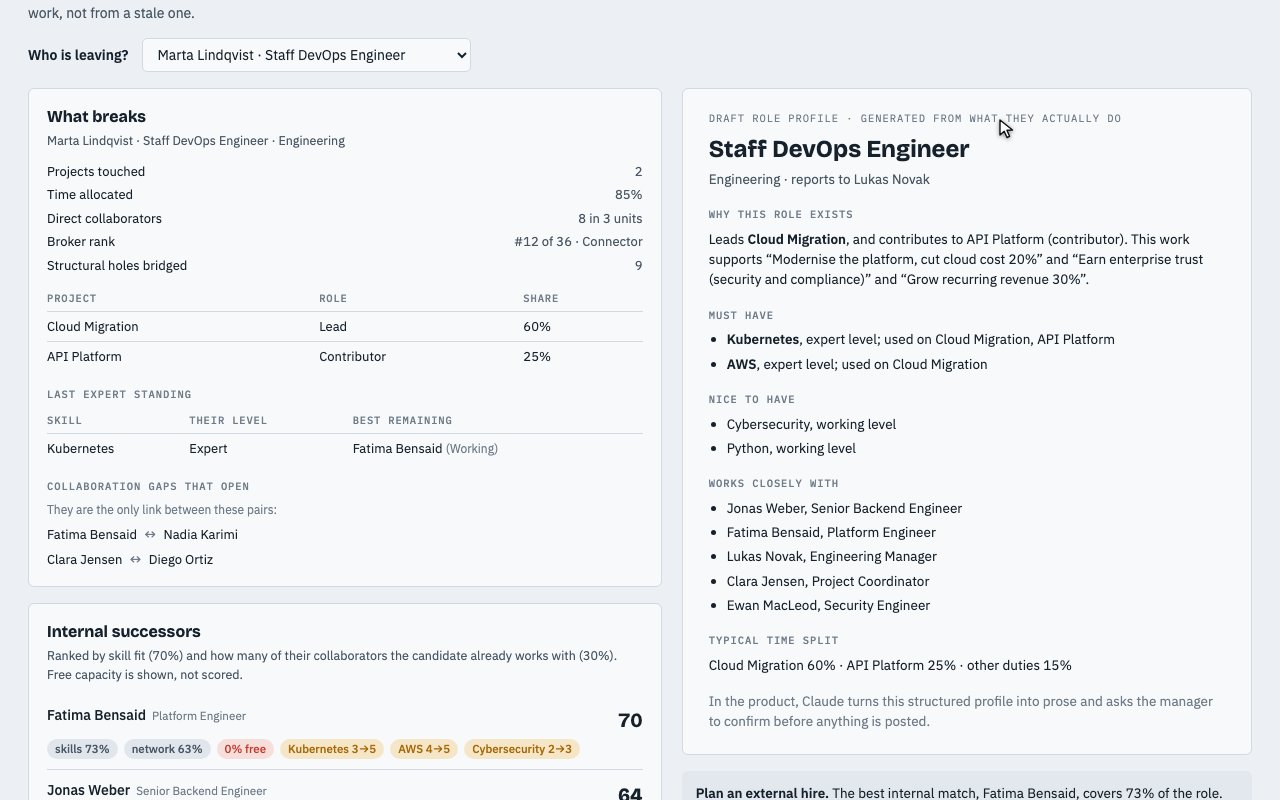
The first question every manager asks is uncomfortable: what breaks if this person leaves?
Network science answers it surprisingly directly. Betweenness shows who sits on the paths between groups. Structural holes show who is the only bridge between two people who would otherwise never talk. Pick a person and Maieutica lists the projects they touch, the skills where they are the last expert, the collaborations that would disappear and who could step in.
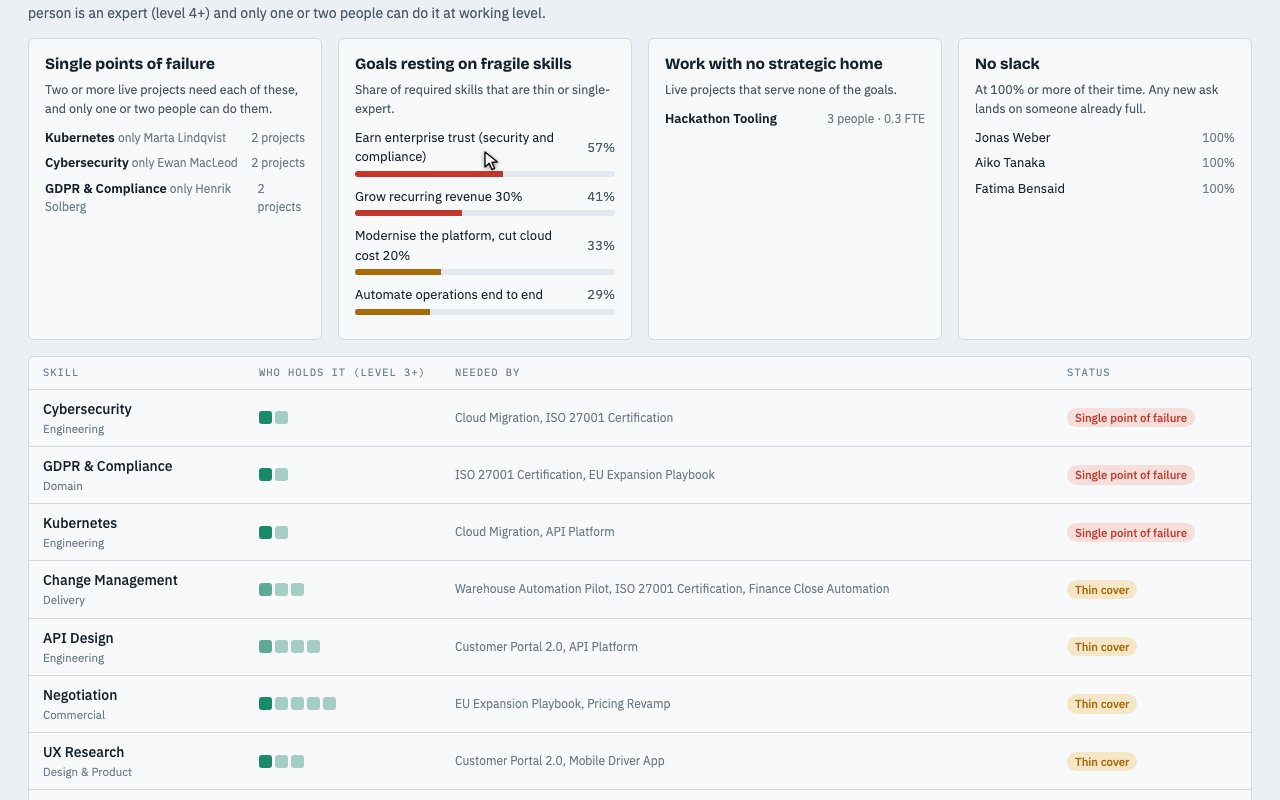
The same graph answers the questions leaders ask in planning: which goals rest on skills only one or two people have, who is booked at a hundred percent, and which projects serve no goal at all.
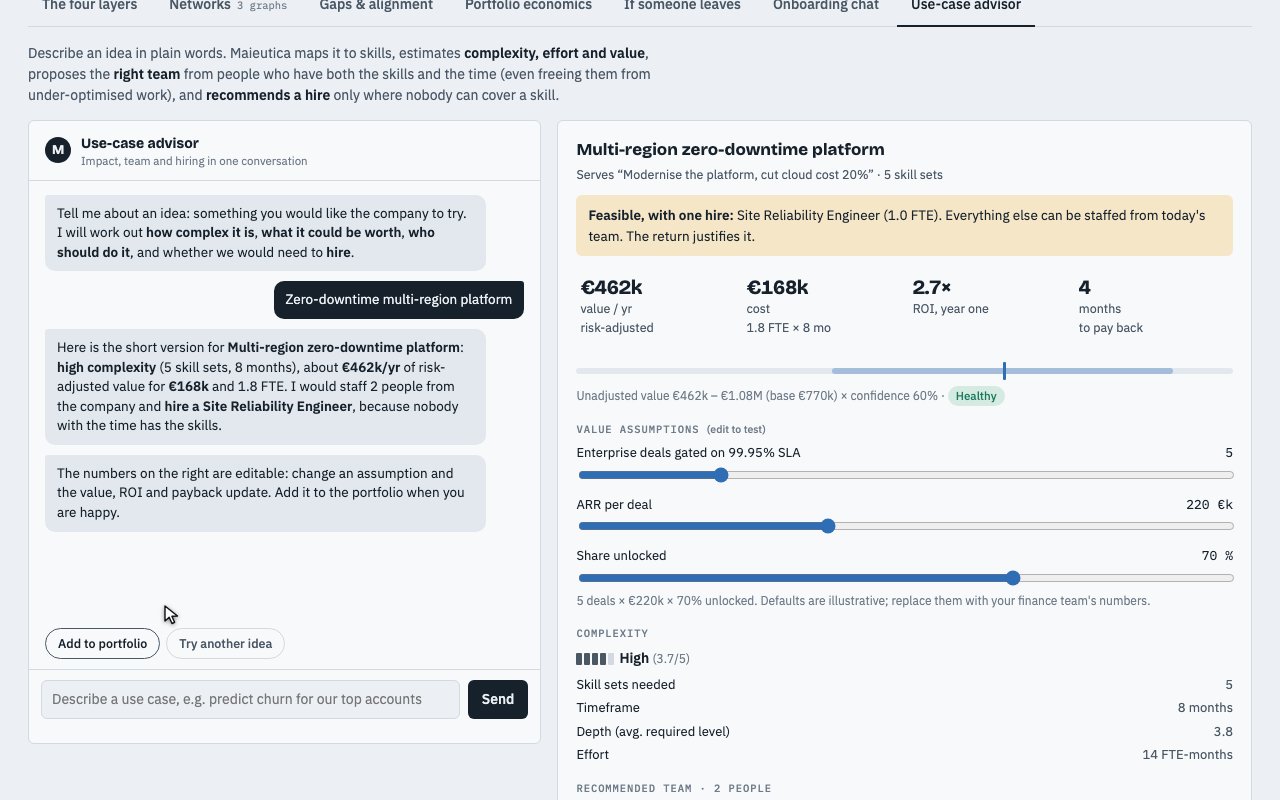
It also works in the other direction. Describe an idea in plain words and Maieutica maps it to the skills it needs, estimates effort, finds the people who have both the skills and the time, and recommends a hire when nobody does. A Jira or Kanban export feeds the graph, and an approved proposal can go back as an epic with its stories.
Everything you see here runs on a synthetic company. The point is the method: once the graph is right, management questions become graph queries.
Made with SQLite / Postgres, D3, Python, Jira REST.
Comments
Sign in with GitHub to leave a comment or react.